
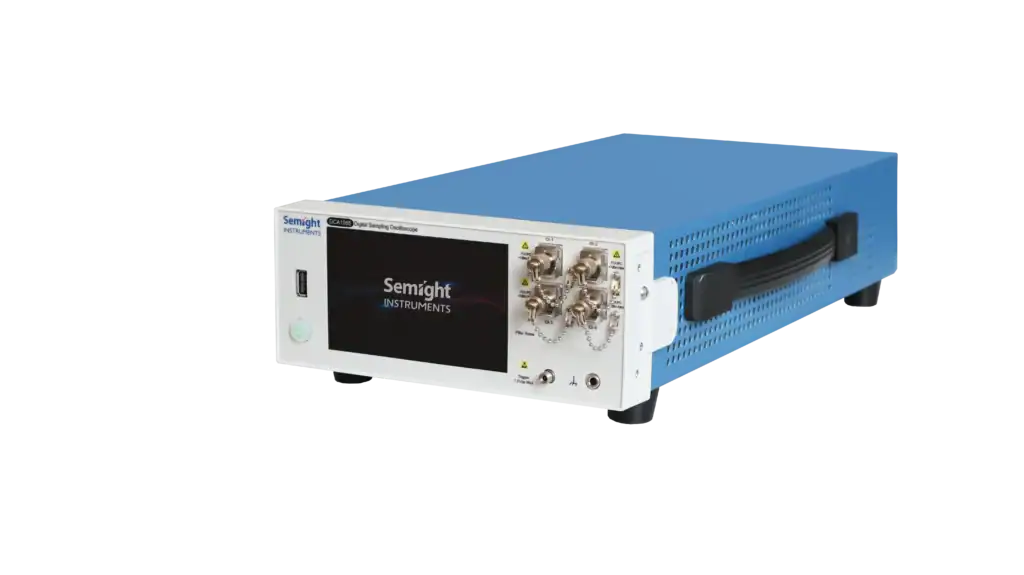
DCA1065
DCA1065
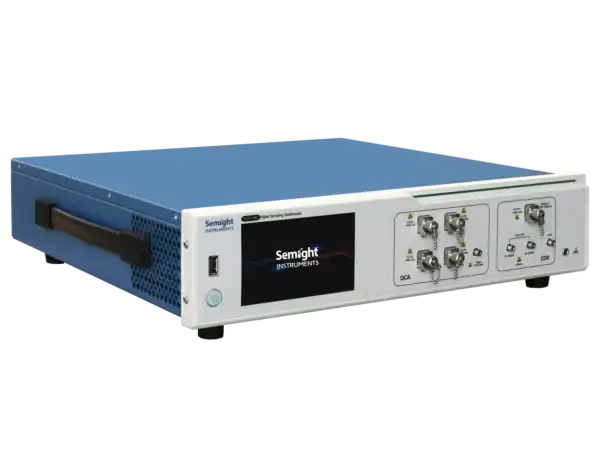
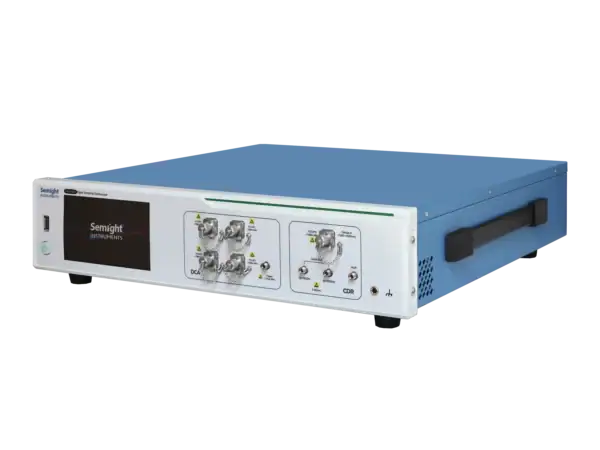
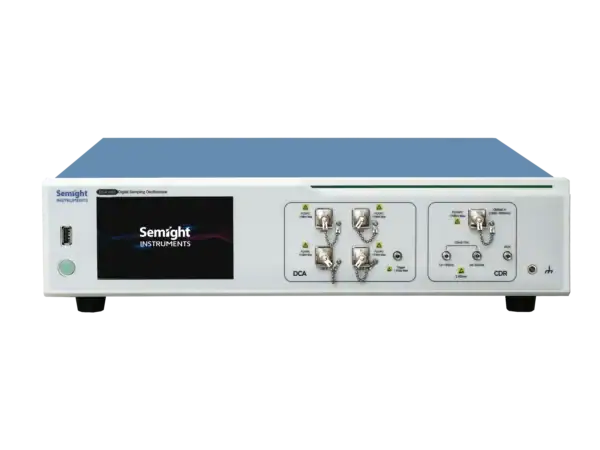
65 GHz Sampling Oscilloscope
DCA1065 facilitates the development of 1.6T optical modules, with symbol rate test capacity for 53/56 GBaud and 106/112 GBaud PAM4 single-mode optical signals (wavelength range: 1250 to 1600 nm). The system response can be corrected and adjusted using System Impulse Response Correction (SIRC) to meet the test requirements for signals at various data rates. Additionally, it supports TDECQ Feed-Forward Equalizer (FFE) with up to 64 Taps, effectively reducing Inter-Symbol Interference (ISI).
Features

Easy to Use
Supports up to 4 channels of 112 GBaud PAM4 signal eye diagram testing

Multiple Measurement Functions
Meets PAM4 eye diagram test requirements
Capable of 200 Gbps/lane signal measurements

Automatic Test
Remote command control mode enables fast and convenient operation

Ensure Accurate Performance
High performance ensures test consistency
Functions and Advantages
Integrated Multi-Port Design
Compact size (half-rack width) to save space.
Available in 1/2/4 channels.
TDECQ (Transmitter and Dispersion Eye Closure for Quaternary) Test
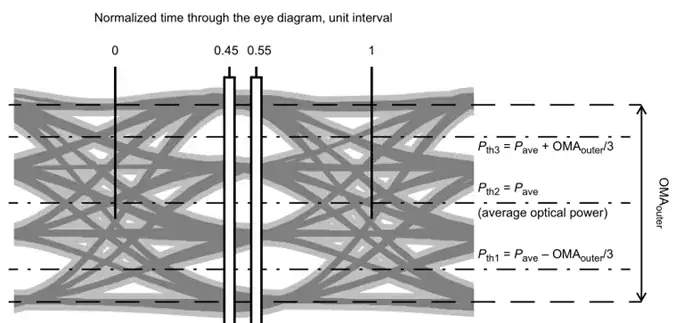
The TDECQ measurement is based on two vertical histograms on the eye diagram. Ideally, these histograms are centered at 0.45 UI and 0.55 UI, maintaining a 0.1 UI separation between them. Each histogram window has a width of 0.04 UI and covers all modulation levels of the eye diagram. The minimum TDECQ value is obtained by precisely adjusting the timing position of the histogram pair.
The figure illustrates the TDECQ measurement window.
OMA Test
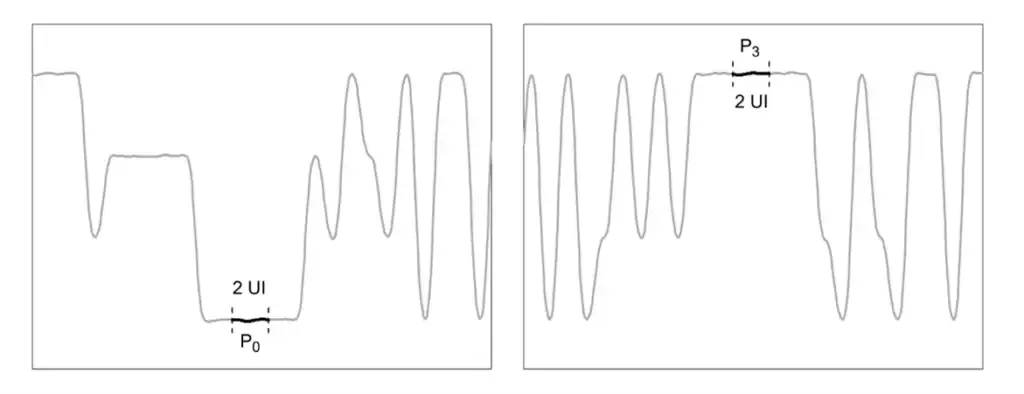
OMA (Outer Optical Modulation Amplitude) refers to the difference between the optical power levels P₃ and P₀, measured at the center of two UIs in a specified test pattern which with 7 consecutive “3”s and 6 consecutive “0”s. The relationship is:
OMA = P₃ – P₀
The OER (Outer Optical Extinction Ratio) is also calculated from these two power level values as:
OER = P₃ / P₀
As shown in the figure, P₀ and P₃ represent the power levels in the definition of Outer OMA/ER.
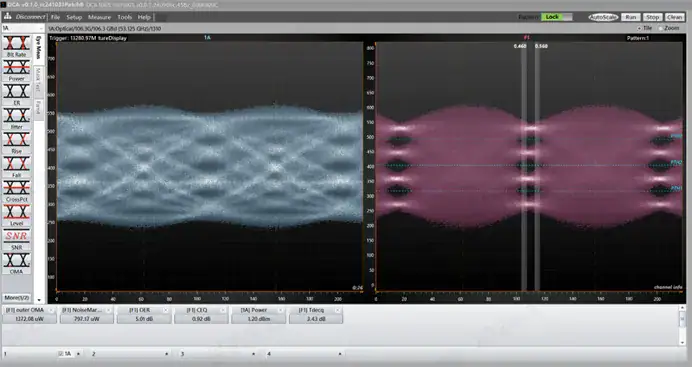
Actual Test of 106.25 GBaud PAM4 Signal
Screenshot of the SSPRQ eye diagram waveform of the 106.25 GBaud PAM4 signal measured by DCA1065.
| Item | Specification |
| Optical Bandwidth [1] | 65 GHz |
| Fiber Input | 9/125μm FC/UPC Single-mode |
| Wavelength Range | 1250 – 1600 nm |
| Factory Calibrated Wavelength [2] | 1310/1550 nm ±10 nm |
| Supports Various Data Rate According to Multi Standards (Filters) | 106.25/112 GBaud PAM4
53.125/56 GBaud PAM4 |
| ADC Resolution | 14 Bit |
| Measurement Consistency [3] | Average Power: ±0.1 dB
Extinction Ratio: ±0.3 dB TDECQ(PAM4): ±0.5 dB |
| Max Input [4]
(Non-Destruction, Peak) |
+5 dBm |
| Sensitivity and Linear Range [5][6] | PAM4: -5 to -1 dBm |
| Monitor Average Power Range | -35 dBm to +1 dBm |
| Average Power Monitor Accuracy | Single-mode ±5% ±200 nW ±connector uncertainty |
| Input Return Loss (FC/UPC) | >30 dB @ 1310 nm |
[1]The optical port bandwidth is defined as the 3 dB optical power drop point which corresponds to -3dBo bandwidth(-3 dBo = -6 dBe).
[2]The ±10 nm value represents the wavelength deviation of the optical source.
[3]This parameter does not characterize the instrument’s performance specification. It represents the difference between the sampling oscilloscope calculated results and the theoretical values when testing with an ideal signal. In practical test scenarios, measurement consistency is related to actual signal quality.
[4]This value is obtained through a destructive test, where input optical power is gradually increased in 0.1 dBm steps. In real applications, due to the uncertainty of the optical source, do not keep the input optical power at +5 dBm or higher for a long time. It may cause damage or performance degradation.
[5] Sensitivity is not used as an instrument specification. It is calculated from the noise characteristic value. It represents the optical power value at which mask test template margins approaching 0% under ideal eye diagram and impacted only by the oscilloscope floor noise. In practical test scenarios, the minimal measurable power is also related to the quality of signal under test.
[6]There are variations between different types of signals (PAM4 data rates, single-mode).